The measured data at each device collected and accumulated by the EQ100 can be unitarily compared,analyzed, and monitored by using EQ-ANDON.
Japanese, English, and Chinese languages are supported
EQS-AD10-E
EQ-ANDON
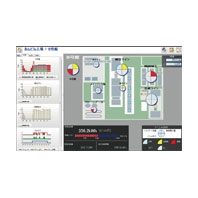
The measured data at each device collected and accumulated by the EQ100 can be unitarily compared,analyzed, and monitored by using EQ-ANDON.
更新日期 2017年12月1日
Features
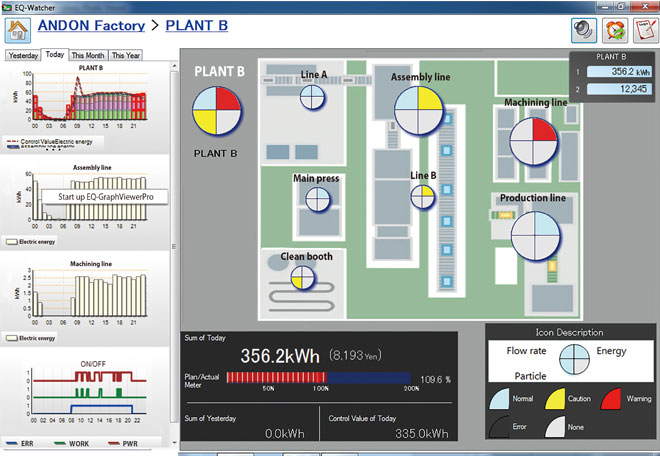
Can clearly glance where and which alarm has occurred.
Target values are automatically calculated and input.
The target value can be automatically input after multiplying the actual value by the rate.
The graph display software enables a detailed analysis.
Detailed analysis can be made by activating the graph display software from the specified graph.
Power ON or OFF of the device can be easily monitored.
The states of the device such as power-ON, under-operation, and error-occurrence can be displayed using a timing chart.
Display namber of graph Maximum 15
Easy to change the site layout
The screen can be easily created.Just paste the image of the floor map and place each icon on it. You can deal with changes in the production line layout by customizing this screen.
The system status can be grasped at a glance because the screen can be designed in accordance with the site.
The current value can be grasped at a glance.
The current value of the information you want to monitor can be displayed.
Alarm occurrence can be recognized at a glance.
The alarm location and type can be quickly recognized at the time of alarm occurrence.
The performance (progress level) can be grasped at a glance.
It can be checked at any time whether the target can be achieved or not at the present pace.
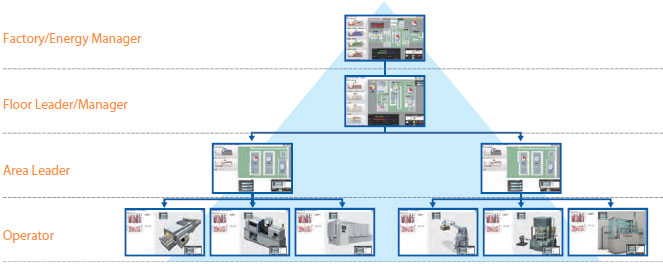
Hierarchical Structure
All-participating-type communication can be realized with the "hierarchy selection" function by which people who want to view can freely confirm their desired places.
Hierarchy screens can be selected and displayed freely.
The hierarchical structure enables to confirm any site situation.The hierarchical screen suitable for the purpose of a person who wants to view from the factory manager to the operator in the site can be displayed.Because the same source data are referred to even if the displayed screen is different, discussions to confirm details can be smoothly carried out, and collaboration among multiple departments can be promoted, and consequently improvement efforts can be made at the organization level in a unified manner.
更新日期 2017年12月1日
 產品類別
產品類別
- 節能/環保檢測裝置
- 監控/分析軟體
- 多功能數據監控分析軟體
- EQS-AD10-E
© Copyright OMRON Corporation 1996 - 2023. All Rights Reserved.